Playlist Tracker
Tableau dashboard for a mobile music applicationOverview
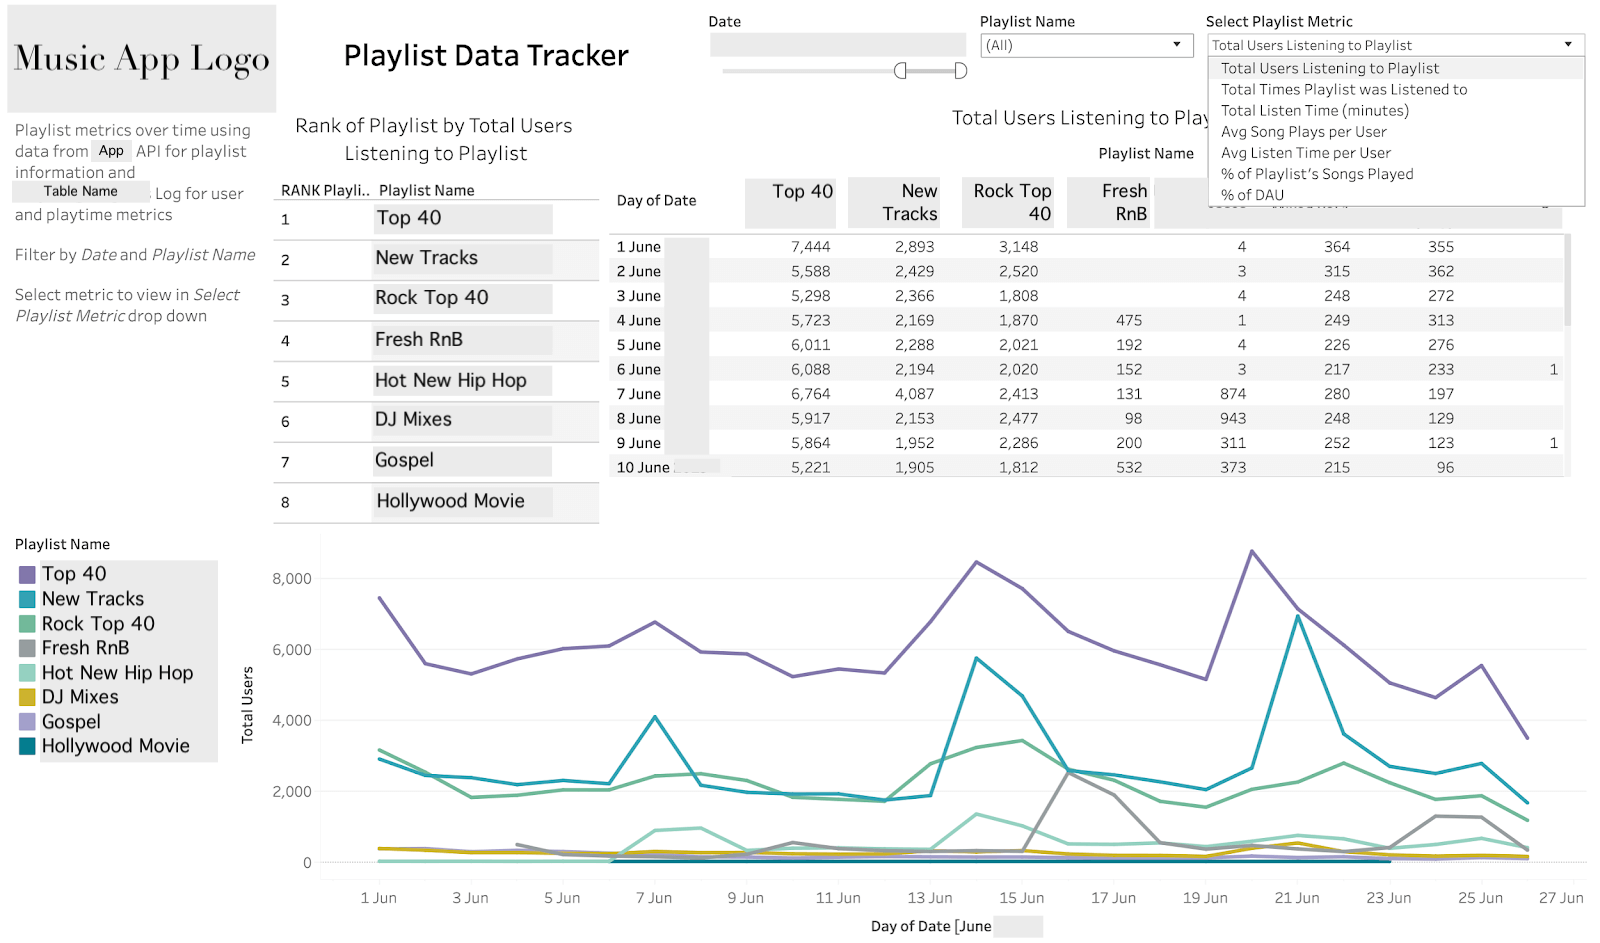
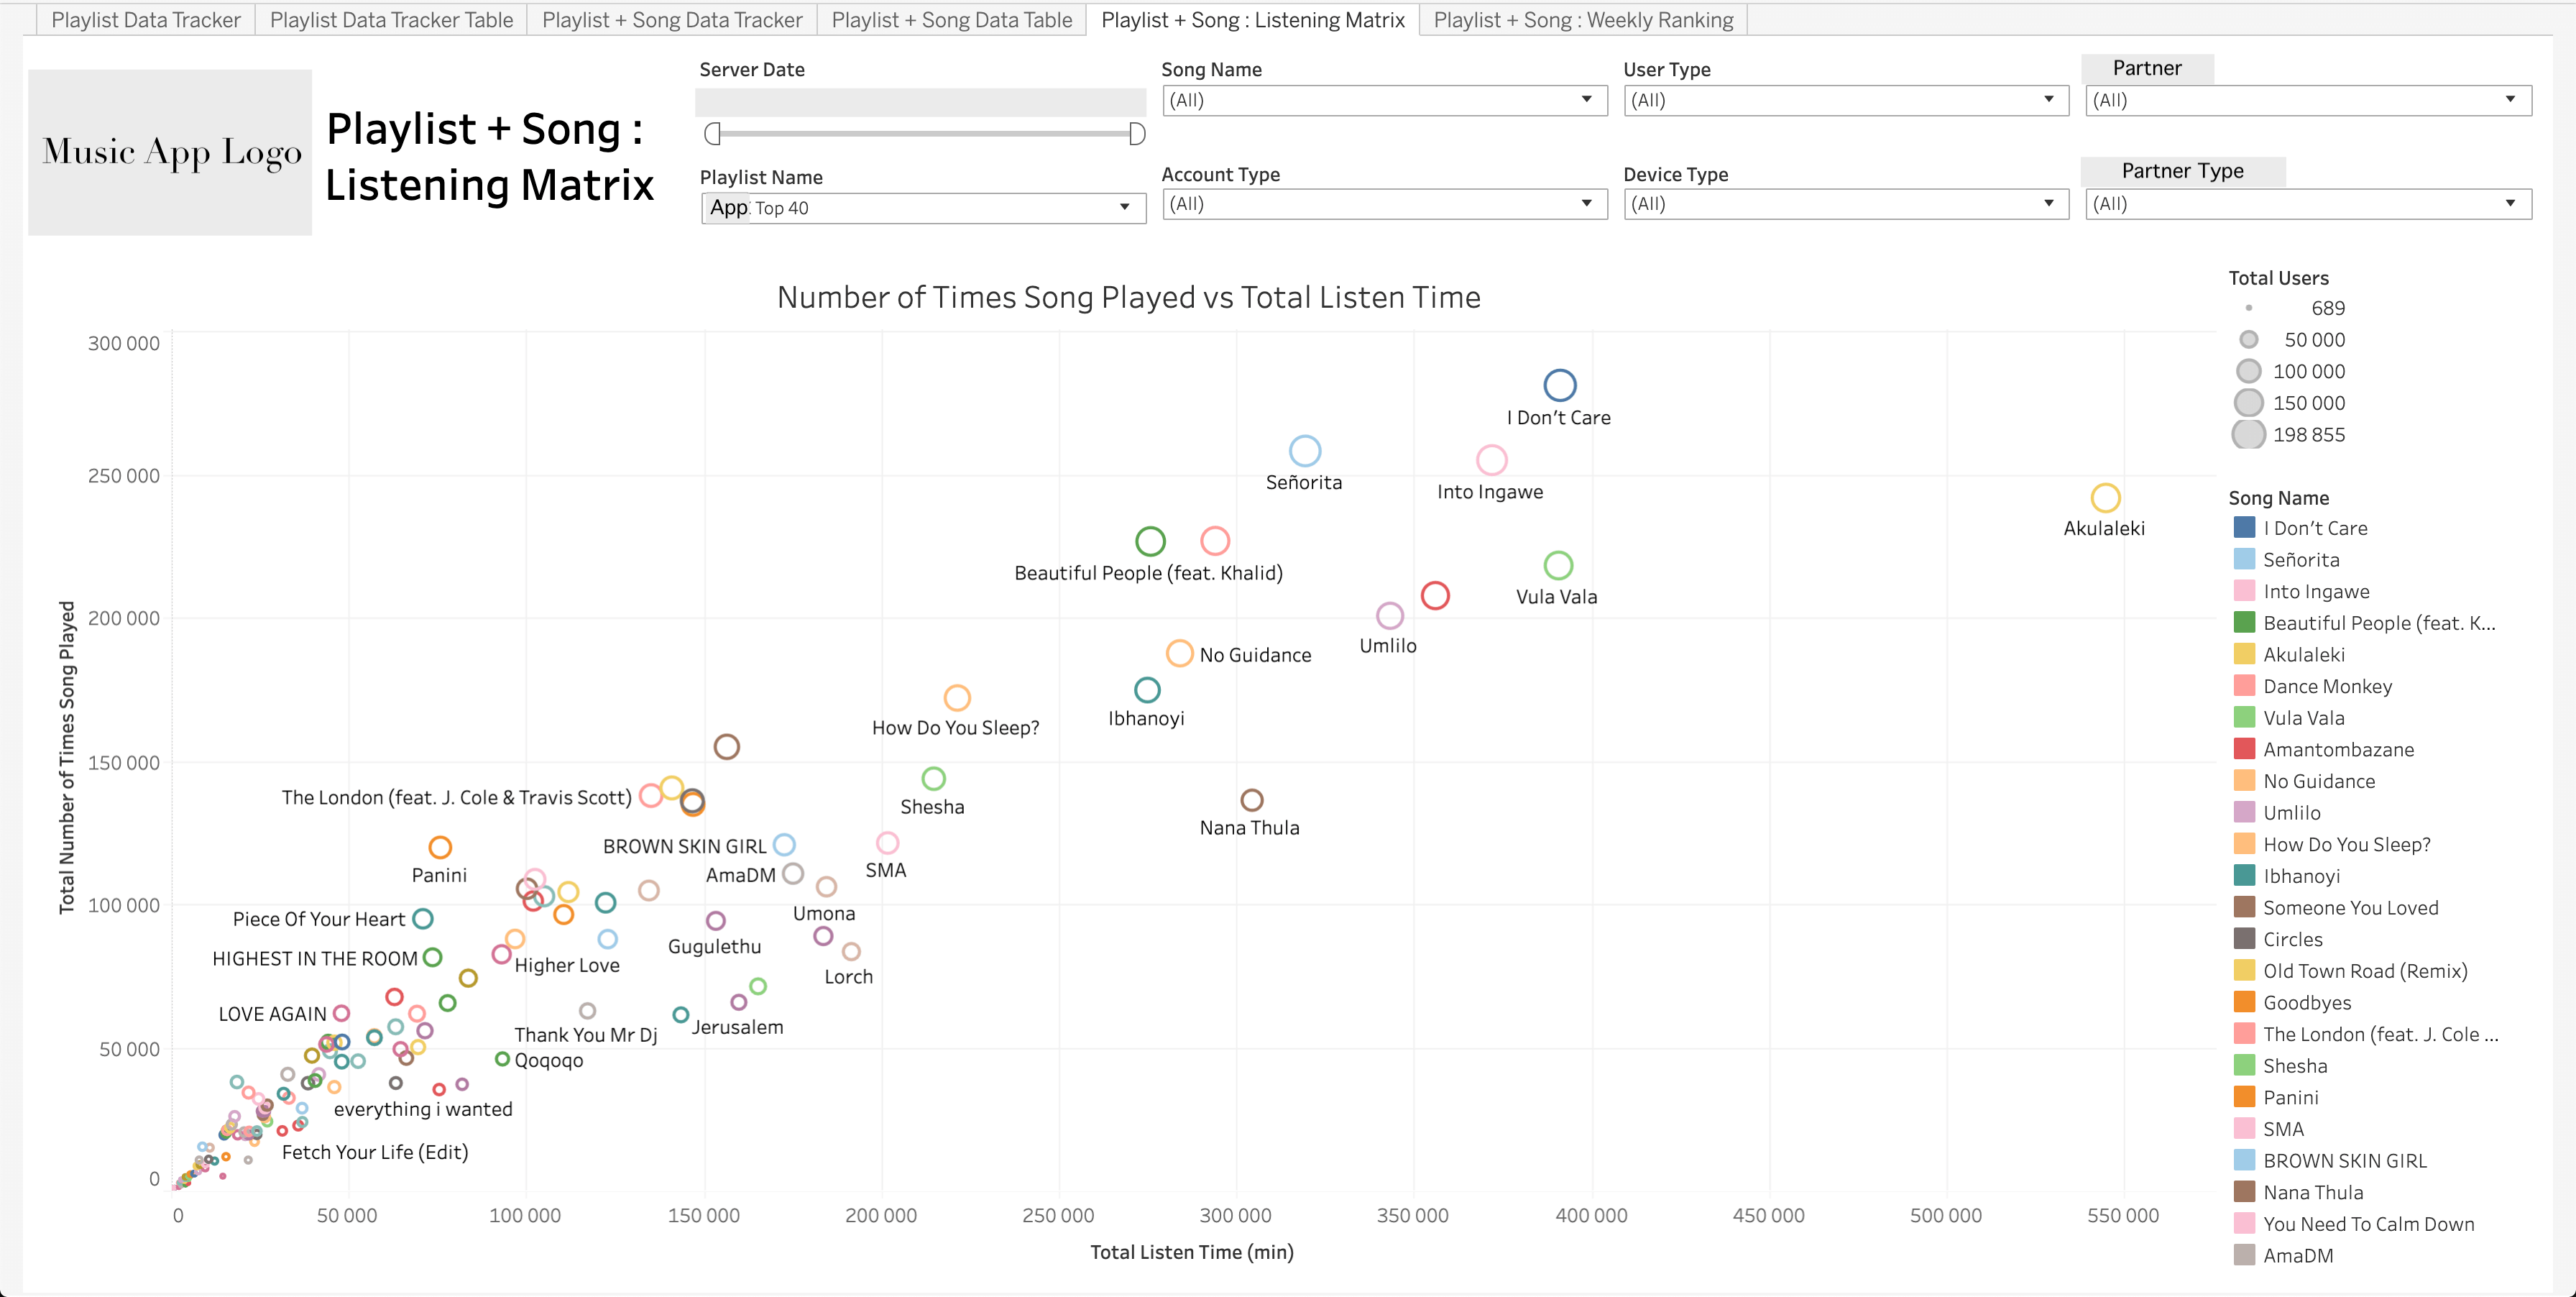
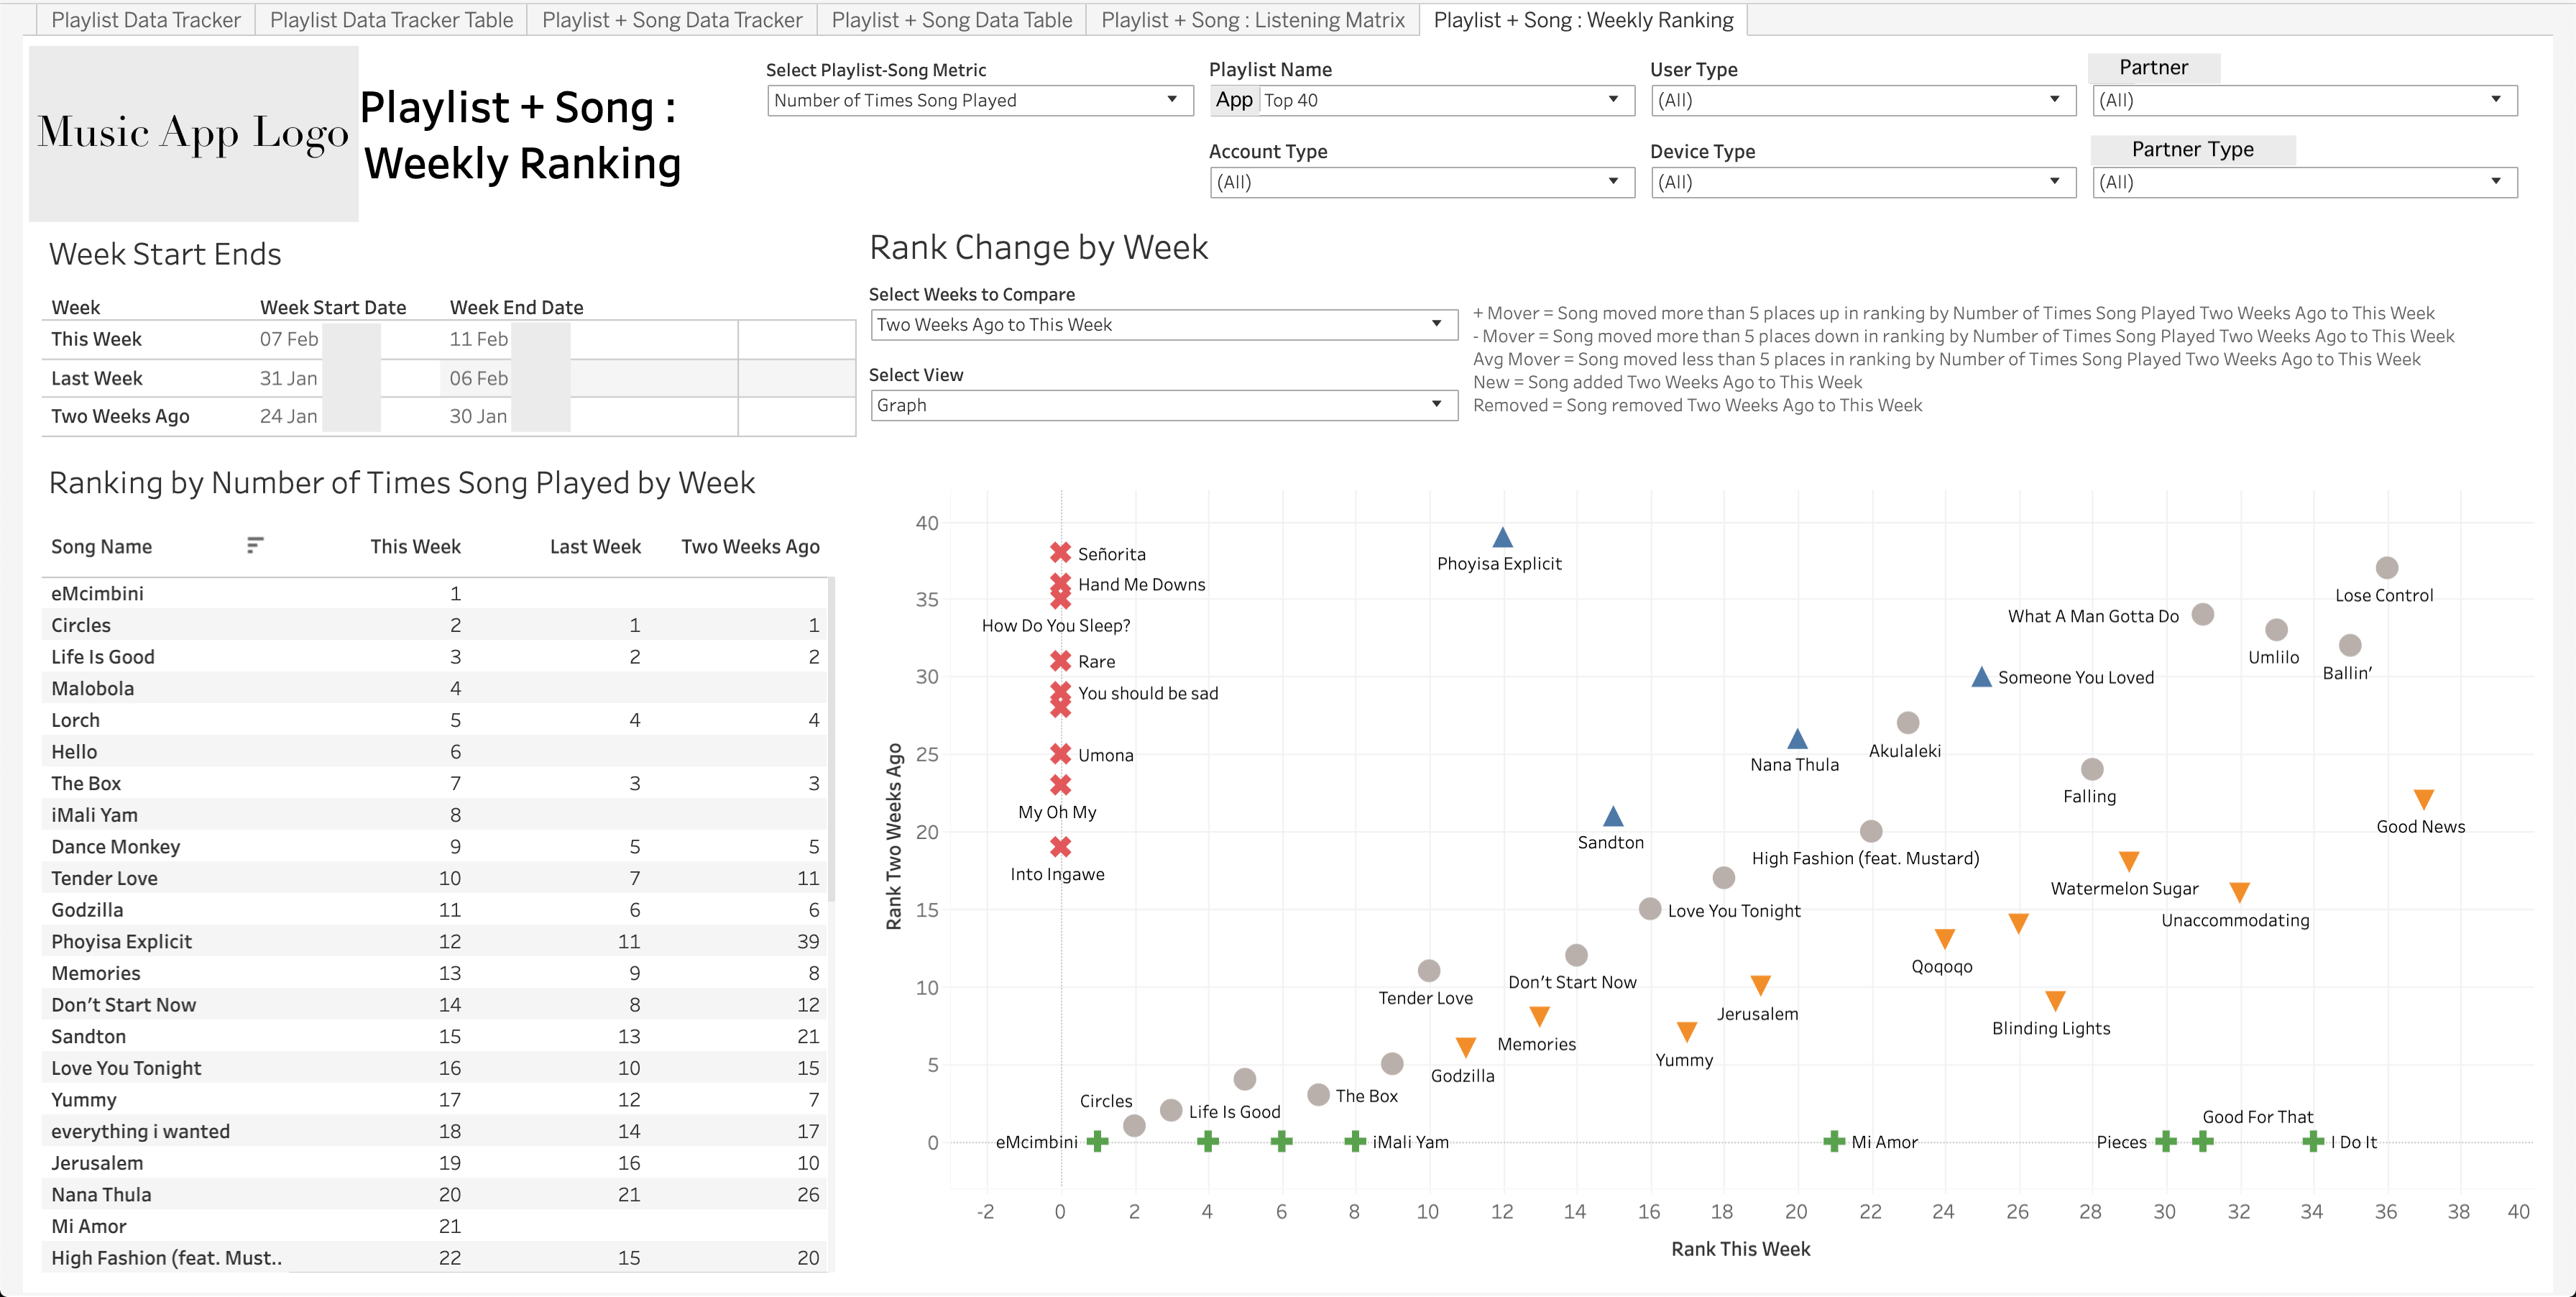
I built a Tableau dashboard to optimise a music application content strategy by tracking the performance of playlists and tracks. This analysis starts by combining a music app’s log data with its content management system data. Both data pipelines are managed using Python and Lambda functions in AWS and these pipelines partition and deposit data into a S3 Data Lake. From there, another Python script run in Lambda creates on-demand EMR clusters to run ETL processes on this raw app log data and create a “data lakehouse” that can be used for reporting by combining S3, Glue and Athena. From there, the analysis of user activity at the playlist and track level alongside input from the content management team resulted in a simple, but powerfully informative dashboard.
This was the first automated reporting made available to the Content team and became the poster chile for the types of automated insights the data team could provide to enable better informed day-to-day operations across the organisation.
Analytical Concepts
- Daily Active Users
- User Segmentation
- Time Series
- User Activity Tracking
- Classification Matrix
Data Stack
- Python
- AWS Lambda
- AWS Glue
- AWS EMR
- AWS S3
- AWS Athena
- SQL
- Tableau


